Brief Quickstart to Stars
In the past few sections, we have discussed the history of astronomy from the ancient Greeks to modern times, covering key figures and discoveries that have shaped our understanding of the cosmos. Stars are the fundamental building blocks of galaxies and play a crucial role in the evolution of the universe. While we will dedicate much more time to discussing stars in the following sections, some readers may want a quick overview of the essential concepts related to stars before diving into the details.
Table of Contents
Stellar Evolution
A star is a massive, luminous sphere of plasma held together by its own gravity.
Our Sun (denoted with
Before a star forms, a cloud of gas and dust called a nebula collapses under its own gravity. As the cloud collapses, it heats up and forms a protostar, defined as a period where the core temperature is not yet high enough for nuclear fusion to occur. Some stars are able to reach about 10 million Kelvin in their cores, which allows hydrogen nuclei to undergo the proton-proton chain reaction, fusing hydrogen into helium and releasing a tremendous amount of energy in the process. This process, known as nuclear fusion, requires extremely high temperatures and pressures, as well as quantum tunneling, to overcome the electrostatic repulsion between positively charged nuclei.
Once nuclear fusion begins, the star enters the main sequence phase, where it spends the majority of its life fusing hydrogen into helium in its core. The outward pressure from the energy released by fusion balances the inward pull of gravity, creating a stable hydrostatic equilibrium for the star. The star's position on the main sequence is determined by its mass, with more massive stars being hotter and more luminous. Young stars may also form protoplanetary disks around them, which can eventually lead to the formation of planets. These are disk-shaped as a result of the conservation of angular momentum during the collapse of the nebula, and thus rotate around the star in the same direction. This is why planets in our solar system all orbit the Sun in the same direction. When a star exhausts the hydrogen in its core, it leaves the main sequence, and its future evolution depends on its mass.
Classification of Stars on the H-R Diagram
Stars are classified based on their spectral characteristics, which are determined by their surface temperature and the absorption lines in their spectra. The most common classification system is the Morgan-Keenan (MK) system, which uses the letters O, B, A, F, G, K, and M to denote different spectral types. O-type stars are the hottest and most massive, while M-type stars are the coolest and least massive. Each spectral type is further divided into subclasses using numbers from 0 to 9, with 0 being the hottest and 9 being the coolest within that type. For example, our Sun is classified as a G2V star, indicating it is a G-type star with a surface temperature of approximately 5,778 K and is a main-sequence star (denoted by the Roman numeral V).
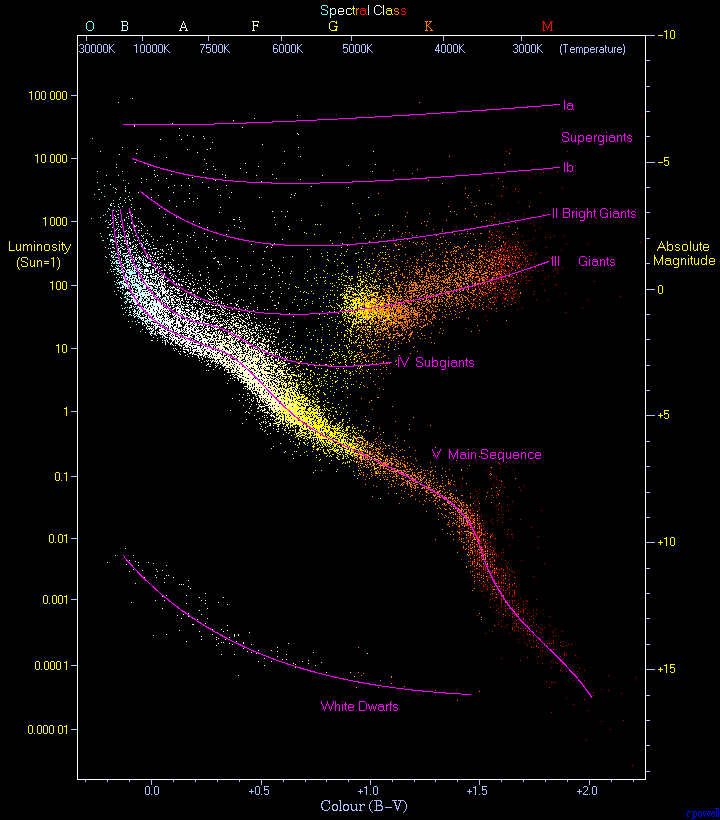
To visualize the classification of stars, we can plot a simplified Hertzsprung-Russell diagram. It is a scatter plot of stars showing the relationship between their absolute magnitudes or luminosities versus their stellar classifications or effective temperatures.

Observational Hertzsprung-Russell diagram, showing the relationship between stellar luminosity and surface temperature. The main sequence is the prominent diagonal band running from the top left (hot, luminous stars) to the bottom right (cool, dim stars). Other regions include giants, supergiants, and white dwarfs. By Richard Powell - The Hertzsprung Russell Diagram, CC BY-SA 2.5, Link
This diagram was independently developed by Ejnar Hertzsprung and Henry Norris Russell in the early 20th century. It reveals distinct groups of stars, including the main sequence, giants, supergiants, and white dwarfs.
The
We can use the formula
to plug into the above equation:
As the